10 RETAIL TRENDS TO WATCH IN 2024
As 2023 comes to a close, it's high time to consider what the next 12 months will bring. The retail...
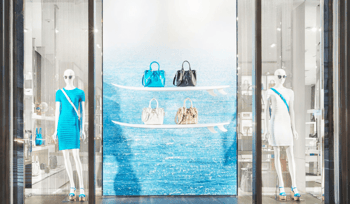
Measuring the Effectiveness of Visual Merchandising Strategies
Visual Merchandising (VM) is a tool and practice for serving the customer, to make shopping inspiring and to increase sales. But, as with any business, every action in-store should be able to be measured in order to follow up and evaluate the performance of VM and its influence on sales. VM should be seen as an investment, as an action built into the overall marketing plan, and not be considered as an expense.
There are several ways to measure the effectiveness of VM. In this post I will cover a couple of ways and show how concentrating on VM and creating a great customer experience is able to increase turnover.
Basket quantity and Basket size
One of the easiest ways to measure the effectiveness of VM, is to simply calculate the basket quantity and the basket size. Why? Because add-on sales are the best way to increase your turnover. It is easier to sell to a person that is already in the store than trying to get more people into the store. In this case, VM can truly act as a silent sales person. The basket size signifies the value of the shopping basket: Sales divided by number of customers.
Naturally there should always be targets set, and follow ups to see if the window displays are performing as they should, and analysis to find out what is working and what is not.
Let’s take an example. How much does 10 euros add-on sales for four customers per day increase the turnover in one year?
We have a brick and mortar store that is open from Monday until Sunday, 4.5 weeks per month. The target is to make 10 € add-on sales with 4 customers per day. The shop owner has items ready for add-on sales, for example scarves that are easily merchandised and styled on mannequins in store. VMs do their display and styling in a way that helps staff to suggest the add-on sales items to the customer (e.g. for rounding up a whole outfit and give it an extra kick). The add-on sales target is also taken into account in window displays, in-store campaigns and in social media marketing campaigns.
Per day: 10 € x 4 = 40 €
Per week: 40 € x 6 = 240 €
Per month: 240 € x 4.5 = 1,080 €
Per year: 1,080 € x 12 = 12,960 €
Calculating per day, week, month and year, you will come to the conclusion that the turnover can be increased by almost 13,000 €! Therefore, imagine the add-on sales target is already taken into account when planning for the upcoming seasons. If buying and planning teams cooperate with the marketing team in advance and the right items are in store at the right time, VMs will be able to display those items, which will have significant impacts on sales.
Translating add-on sales targets for in-store teams
Imagine a company that has 200,000 € turnover per year. They want to increase sales by 10% (20,000 €). Now the question is how to make a sales target for add-on sales more reachable and easier to grasp for retail employees? How can a VM do his or her work in a way that is aiming for the target while planning and creating the displays?
What I did while working as a store manager, is that I simply divided the big amount into monthly, weekly, daily targets and even divided it into product levels. This basically signifies using the basket size option, only in a reversed way.
Let’s assume the store is open six days a week for 4,5 weeks per month. In order to reach the target of 20,000 €, the company needs to have additional sales:
20,000 €/12 ≈ 1,667 € per month
1,667 €/4.5 ≈ 370 € per week
370 €/6 ≈ 62 € per day
Breaking it down, we know that add-on sales worth 62 € per day have to be reached. This could be divided into 10 € per 6 customers, or one product of that price per customer, or two worth 31 € items etc. This target also provides a monetary target for Visual Merchandisers whilst planning displays and product combinations.
Another tool to measure in-store merchandising, service and store performance, is to calculate the hit rate: the percentage of how many store visitors actually bought something. It is easily calculated by the number of sales divided by the number of visitors.
How to use Basket Size and hit rate to measure the possible effects of Visual Merchandising in creating more sales?
Imagine a store owner, that has a shop with a yearly turnover of 200,000 €, hit rate is 20% and the basket size is 25 €. Furthermore, there are 40,000 visitors and 8000 sales per year. When people are passing the store, the rule says that 10% of passersby actually enter your store. In this example we know that as a result 400,000 potential customers pass by our store annually. If the store owner decides to increase the passersby number by 1 %, and hit rate and basket size would stay the same, the shop could increase sales by 10 %. Have a look at the calculation in figure 1.
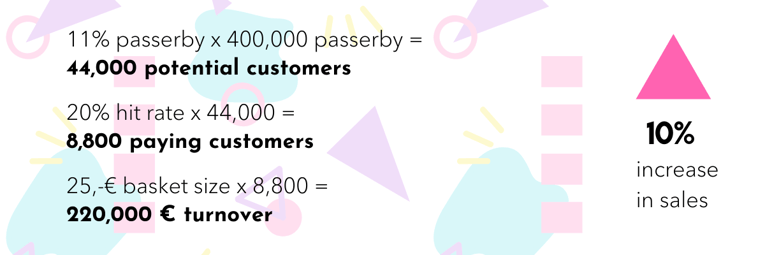
Figure 1. Increasing number of passersby with appealing Window display campaigns
To reach the target of increasing the hit rate up to 20 % with 11 % of passersby entering the store, the store owner decides to invest in great customer service and customer experience, having great items ready for campaigns, themes, sets and styling in order and seasonal items at the right time at the right place. Just by increasing the hit rate by 5%, its effect on increasing sales is 25%.
The third step to include a raise in basket size. The right styling of add-on sales and specific marketing strategies are helpful to inspire the customer in-store. Creative window displays even draw more people into the store. By increasing the basket size by e.g. 10 € would lead to a turnover growth by 40 % compared to the original numbers.
So what if you as a store owner truly understand the value of VM, great customer service and you decide to increase hit rate by 5%, basket size by 10 € and get 1% additional passersby into your store? In Figure 2 you can see that the result would be a 92,5% raise in sales. Sounds promising, right?
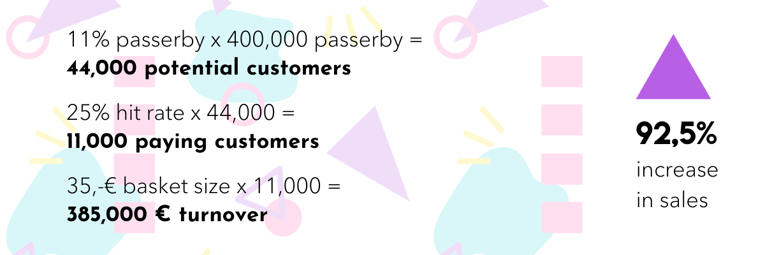
Figure 2. Increasing passersby, hit rate and basket size lead to a high increase in sales.
Setting targets to increase hit rate, turning passersby in actual customers and enhance basket size should all be accompanied by an omni-channel customer experience, great VM and exceptional marketing strategies. If you successfully implement all VM strategies, you have the right items at the right times in-store and your omni-channel marketing works out, you will be able to increase your turnover by 92,5%!
Strategically planned seasonal add-on items in-store, a tidy store front and well laid out window displays are hereby all factors that VMs have to keep in mind. This way VM can significantly help to increase turnover
About Anna Juusela
Anna, a Finnish “Retail Whisperer” studied Fashion/Apparel Design at the Seinäjoki University of Applied Sciences and teaches Visual Merchandisers and store owners on how to calculate and measure the effectiveness of VM at AJK-Jatkokoulutus since 2014 in Helsinki. In July 2011 she founded her own company Yanca Oy Ltd where she offers services for small and medium-sized retail companies in the field of VM online and offline, purchase planning, stock management and financial administration. Additionally, she works as a lecturer and is a founder of Retail Tips by Yanca, a Website that shares interesting retail related information, and blog articles about VM.
Never miss out on latest news in the retail industry on Facebook, LinkedIn or Instagram.